A supervisor has the responsibility to manage, guide and coach an agent for the QA processes. The supervisor console displays sets of data and analytical reports to track down the performance of agent(s). Further, a supervisor user role will have the console in the following format-

The supervisor screen resembles much likely to that of the agent home screen including its own set of data. The supervisor home page also consists of the following tabs-
The above mentioned tabs are based on access rights. Admin can assign separate rights to individual user.
To get the data in the dashboard, a supervisor needs to-
- Make entries in the “start date” and “end date” fields
- Click on the
 button.
The user can also scroll down the screen to view the other related data as shown-

The displayed elements along with their descriptions are given below
|
Dashboard Elements |
Description |
|
Total Evaluation |
Displays the number of total evaluations of the agent. |
|
Total Evaluation without Autofail |
Displays the number of total evaluation without considering Autofail. |
|
Total Autofail Evaluation |
Displays total number of Autofail evaluations. |
|
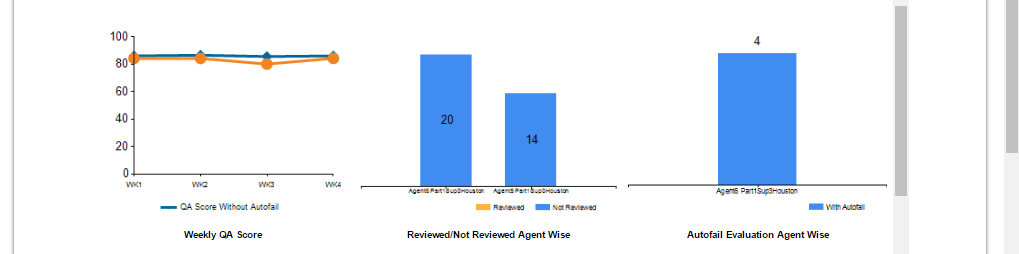
Weekly QA Score |
Shows weekly QA score of the agent without considering Autofail |
|
Reviewed/Not Reviewed Agent wise |
Displays reviewed and not reviewed bar graph reports for agents |
|
Autofail Evaluation Agent Wise |
Displays bar graph evaluation accordingly for separate agents considering autofail |
|
Agent Disputed Summary |
Summarizes the total disputes. Open- Shows the Agent’s number of open disputes. Closed- Shows the Agent’s number of closed disputes. Accepted- Shows the accepted disputes. Decline- Shows the declined disputes of the Agent. |
|
QA Score |
Pie Chart- Represents the total QA score of the agent in percentage. Line graph- Represents the QA score for the selected duration (by default displays last four week data). Bar graph- Represent the evaluations (Total Evaluation, Total Evaluation without Autofail and Total Autofail Evaluation) for the selected duration.
|
|
QA with Autofail |
Pie Chart- Represents the total QA score of the agent in percentage. Line graph- Represents the QA score for the selected duration (by default displays last four week data). Bar graph- Represents the evaluations (Total Evaluation, Total Evaluation without Autofail and Total Autofail Evaluation) for the selected duration. |
|
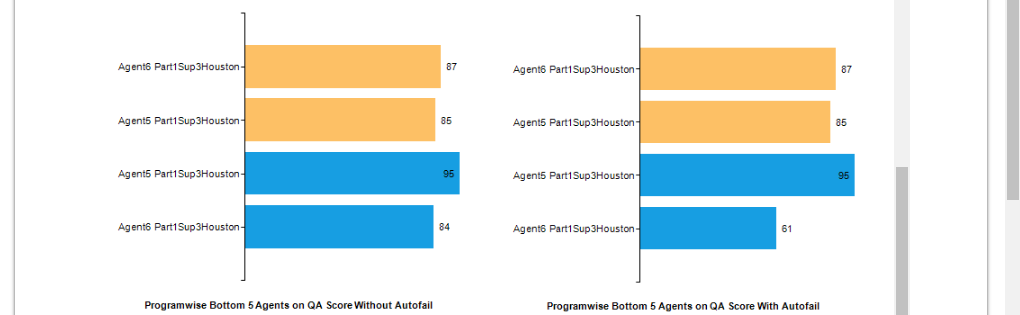
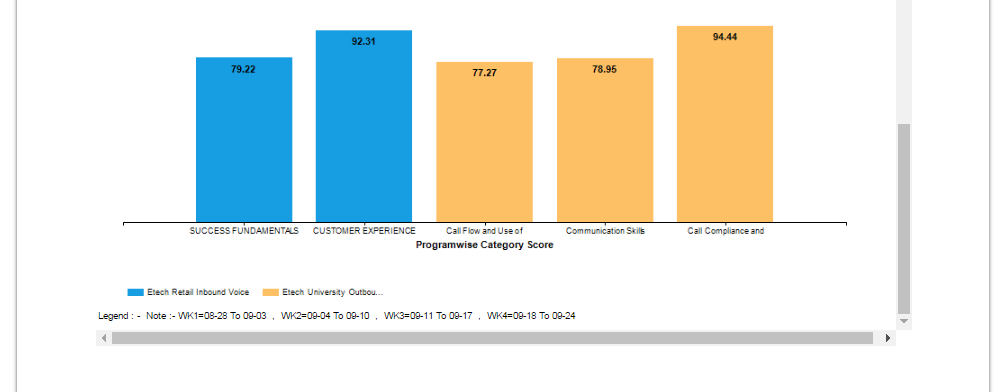
Programwise Score |
Diplays QA score for bottom 5 agents and category with and without autofail |
Program QA Performance-
A supervisor will be able to access the following data after clicking on Program QA Performance-

The screen includes the weekly data for Voice programs and Chat programs. A Supervisor can also print the data using ![]() button
button
Overall QA Program Score-
A supervisor would be redirected to the following screen once he clicks to the Overall QA Program Score tab-

To get the data for overall QA score-
• The supervisor needs to make entries for Program, Evaluation Form and End Date
•The data is generated by clicking on ![]() button
button
The data displayed will include the QA score outputs for Weekwise, Centerwise and Categorywise along with Weekly Top 3 Defects Category for agents
Disputed Evaluations-
The tab displays the number of open, closed and total disputes on the console. This is as shown in the below image-

Coaching-
This tab will display the number of open, closed and total coaching for agent(s) of the supervisor. This is as shown in the below screen-

Active User Dashboard-
With the use of this tab, a supervisor will be able to view total personal active hours along with the active hours of his/her team member(s). This is as shown below-
 By default the system will display the active hours for current day. However, a supervisor has the option to view the active hours for particular number of days for his/her team members individually. This could be done by entering the required dates in Start Date and End Date fields.
Note- The active hours data will be displayed in CST zone.
Video