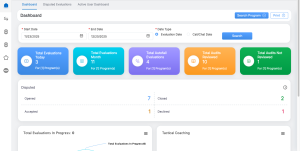
A QA verifier in QEvalPro environment has an authority to evaluate the performance made by agents. Hence, a QA verifier console includes evaluate tab as shown in the below screen-

Apart from this, the other two tabs on QA verifier home screen are-
The above mentioned tabs are based on access rights. Admin can assign separate rights to individual user.
A QA verifier could view the data on his dashboard by following steps-
- Making entries in the provided start and end date entries
- Clicking on the
 button
Further, the other entities in the dashboard include-
|
Dashboard Elements |
Description |
|
Total evaluation today |
Shows the total updated evaluation for the day |
|
Total evaluation month |
Displays the updated evaluation for the current month |
|
Total autofail evaluation |
Shows agent’s evaluation considering autofail entries |
|
Disputed evaluation summary |
Summarizes the total disputes. Open- Shows the Agent’s number of open disputes. Closed- Shows the Agent’s number of closed disputes. Accepted- Shows the accepted disputes. Decline- Shows the declined disputes of the Agent.
|
|
Total audit reviewed |
Figures the number of audit which have been reviewed till date |
|
Total audit not reviewed |
Displays the number of unattended reviews till date |
|
Total evaluation in progress |
Number of evaluation which are currently going on |
Disputed Evaluations-
Displays the total number of disputed evaluations along with individual stats of Open and Closed disputed evaluations. This is as shown below-

Active User Dashboard-
QA Verifier can view his total active hours in the system through the use of this tab. The number of hours will be displayed in the following format-

By default the system will display the active hours for current day. However, a QA Verifier has the option to view the active hours for particular number of days. This could be done by entering the required dates in Start Date and End Date fields.
Note- The active hours data will be displayed in CST zone.
Video