A QEvalPro agent console allows an agent to perform and review evaluations. The console also includes personalized dashboard. It displays various analytical data on the basis of evaluations and other parameters in the form of figures, charts and graphs.
Tabs displayed on Agent’s account:
The above mentioned tabs are based on access rights. Admin can assign separate rights to individual user.
1.Agent Dashboard

Scroll down to view more on dashboard.

Dashboard displays the Evaluations, QA score and disputes summary. The default view displays the summary of last four weeks data on the dashboard.
• To select the data for particular duration, enter the Start Date and End Date.
• Click ![]()
|
Dashboard elements |
Description |
|---|---|
|
Total Evaluation |
Displays the number of total evaluations of the agent. |
|
Total Evaluation without Autofail |
Displays the number of total evaluation without considering Autofail. |
|
Total Autofail Evaluation |
Displays total number of Autofail evaluations. |
|
Disputed Evaluation Summary |
Summarizes the total disputes. Open– Shows the Agent’s number of open disputes. Closed– Shows the Agent’s number of closed disputes. Accepted– Shows the accepted disputes. Decline– Shows the declined disputes of the Agent.
|
|
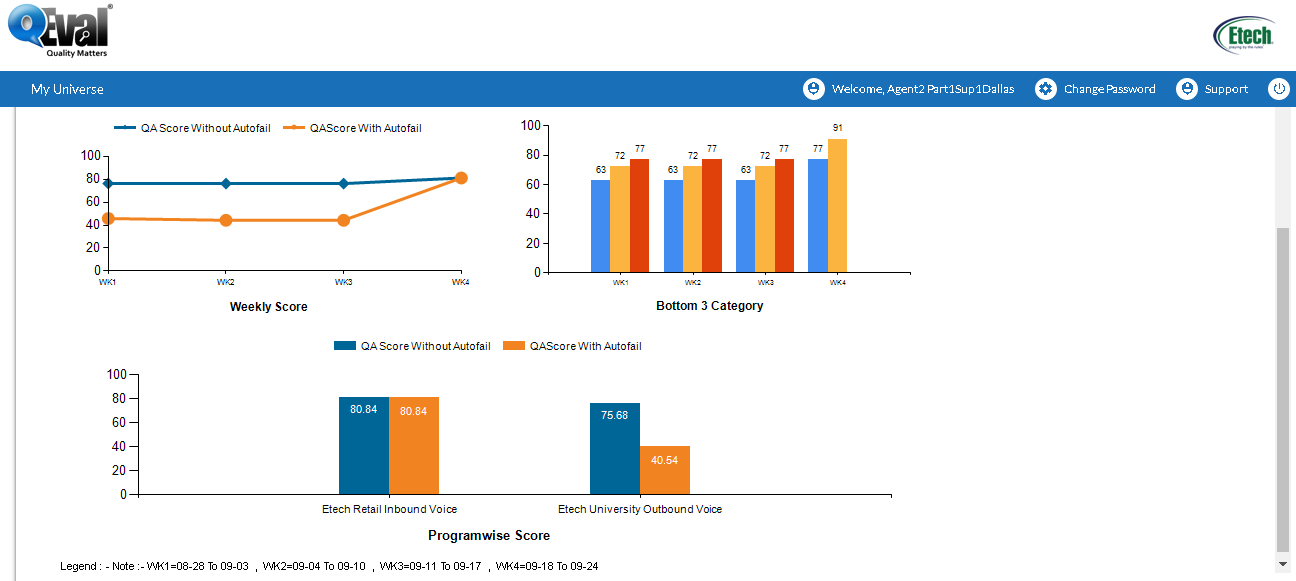
QA score |
Pie Chart– Represents the total QA score of the agent in percentage. Line graph– Represents the QA score for the selected duration (by default displays last four week data). Bar graph– Represents the comparison of all the evaluations (Total Evaluation, Total Evaluation without Autofail and Total Autofail Evaluation) for the selected duration.
|
|
QA with Autofail |
Pie Chart– Represents the total QA score of the agent in percentage. Line graph– Represents the QA score for the selected duration (by default displays last four week data). Bar graph– Represents the comparison of all the evaluations (Total Evaluation, Total Evaluation without Autofail and Total Autofail Evaluation) for the selected duration.
|
|
Programwise score |
Displays the QA score with and without Autofail of the agent for |
2. Coaching-
An agent dashboard includes coaching tab as displayed in the below screen-

The figure on coaching tab displays the pending coaching to be completed by an agent. Click the tab and system displays the following set of information-

The screen includes the total number of open coaching, closed coaching and total coaching (sum of open and closed coaching) for an agent
An Open coaching tab will display the list of pending coaching in the grid to be completed by an agent. Similarly a Closed coaching displays the list of completed coaching by an agent in the list.
An agent has the option to view and complete the coaching by clicking on Answer ID link in the grid. This is as shown in the screen below-

3. KPI Dashboard-
An agent console includes KPI Dashboard tab as shown in the below screen-

Click on the tab and the system displays the following screen-

A KPI dashboard displays the key performance behavior (KPB Index) and score comparison of an agent with his/her team and program. Based upon the performance, the dashboard also displays the predicted score of an agent for upcoming weeks. Thus, it helps the an agent to analyze the performance and to improve if needed.
Shown highlighted in the above screen, select client name, program name from dropdown fields and the date range. Click Search button to view KPB index, score comparisons and predicted performance. The system displays the result in following format-

Scroll down for more reports-


Strategic Parameter Score

Video